PileGroup Validation - Example 4. Verification of lateral displacement predictions for a 3×3 pile group in sand (Rollins et al. 2005)
- Apr 2
- 3 min read
This example is based on the full-scale lateral load test of a 3 × 3 pile group reported by Rollins et al. (2005). The piles were spaced at 3.3 diameters centre-to-centre and were driven open-ended into a soil profile consisting of loose to medium-dense sand underlain by clay. Each pile was a steel pipe with an external diameter of 0.324 m and a wall thickness of 9.5 mm, driven to a depth of approximately 11.5 m below the excavated ground surface.
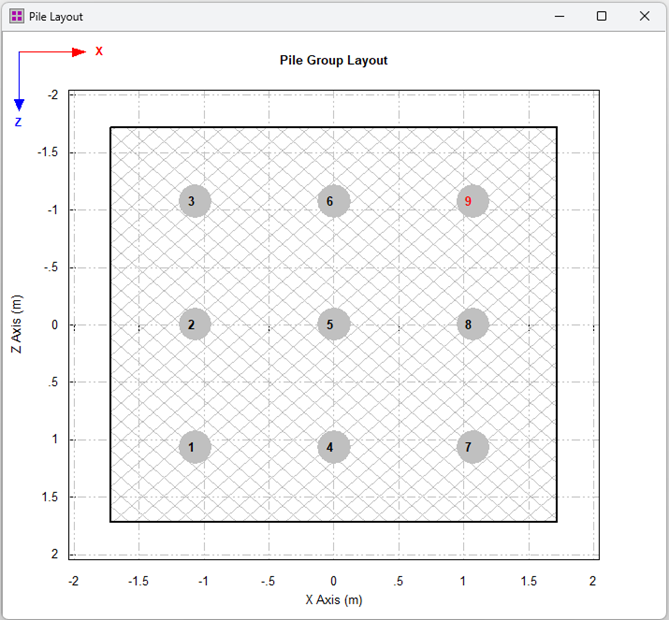
The moment of inertia of the pipe section was 1.16 × 10⁸ mm⁴. Due to the presence of angle irons attached to opposite sides of the pile in the loading direction to protect the strain gauges, the actual moment of inertia increased to 1.43 × 10⁸ mm⁴. A horizontal load was applied at a height of 0.69 m above the ground surface. The pile-to-cap connection was pinned for all piles. The layout of the pile group is shown in the figure below.
The ground profile and soil properties adopted in this example are shown in the table below.

The figure below shows the three-dimensional view of this 3 x 3 pile group modelled in the PileGroup program.

The figure below shows the soil layer information, pile group and pile cap loads defined in the program. It shows the thickness values for all the layers and also the pile lengths.

For this example, the pile group effect option “User-specified p-multipliers for pile group effect” was adopted. According to Rollins et al. (2005), the p-multiplier values were taken as 0.8 for the front row and 0.4 for the remaining second to fourth rows. The adopted p-multipliers for all piles within the group are illustrated in Figure 4-4.

The following figure presents a comparison of the pile head displacement profiles for the 3 × 3 pile group under lateral loading. The results obtained from the analysis using the PileGroup program are shown together with the measured field data and the predictions reported by Rollins et al. (2005) using the GROUP (Reese et al. 1996) and SWM (Ashour et al. 2002) programs. The numerical predictions from the PileGroup program show excellent agreement with both the experimental measurements and the other two programs across the entire load–displacement range.

In particular, the PileGroup program results capture the nonlinear stiffness behaviour of the pile group system and reproduce the measured group interaction effects with high accuracy. The model accurately predicts the progressive reduction in lateral stiffness as the load increases and successfully reflects the influence of pile–soil–pile interaction within the group, which is known to govern the overall displacement response. The close match between the calculated and measured results demonstrates the robustness of the implemented p–y curve formulation, group reduction factors, and load transfer mechanisms adopted in the PileGroup program.
References:
Ashour, M., Norris, G. M., and Pilling, P. (2002). Strain wedge model for laterally loaded piles and pile groups. Journal of Bridge Engineering, ASCE, 7(4), 245–254.
Reese, L. C., and Wang, J. T. (1996). GROUP: A Computer Program for Analysis of Laterally Loaded Piles and Pile Groups. Report/Program, University of Texas at Austin, Center for Transportation Research.
Rollins, K. M., Lane, J. D., and Gerber, T. M. (2005). Measured and computed lateral response of a pile group in sand. Journal of Geotechnical and Geoenvironmental Engineering, ASCE, 131(1), 103–114.


Comments