PileGroup Validation - Example 7. Centrifuge lateral load test of a 3x4 pile group in loose sand (Zhang et al. 1999)
- Apr 2
- 3 min read
This example is based on the centrifuge lateral load test of a 3 × 4 pile group founded in loose sand reported by Zhang et al. (1999). The model square aluminium piles were 9.5 mm wide and 304.8 mm long and located at 3-diameter spacing from one another. The centrifuge tests were conducted at 45g, which simulated prototype piles of 13.2 m in length, 0.429 m in width and embedment depth of 10.9 m in the sand. The free length, defined as the distance from the point of lateral loading to the ground surface, was measured at 2.3 m for 3 x 4 pile group installed in loose sand with fixed heads. In the centrifuge test, the unit weight was 14.05 kN/m3 for loose sand, the effective friction angle is 34.5 degree, and the coefficient of lateral subgrade reaction is 1.357 MN/m3.

Zhang et al. (1999) first simulated the single-pile test and calibrated the p–y curves by adjusting the soil parameters until the computed response matched the measured behaviour using FLPIER program. The subsequent pile group tests were simulated using the same computer program with the calibrated p–y curves, incorporating row-dependent p-multipliers to account for group interaction effects. Based on the test data, the leading row exhibited the highest p-multiplier, while the trailing rows showed progressively smaller values. The reported p-multipliers were 0.8 for the leading row, 0.4 for the second row, 0.3 for the third and fourth rows. The layout of the pile group is shown in Figure 7-1. The ground profile and soil properties adopted in this example are shown in the table below.

The figure below shows the three-dimensional view of this 3 x 4 pile group modelled in the PileGroup program.

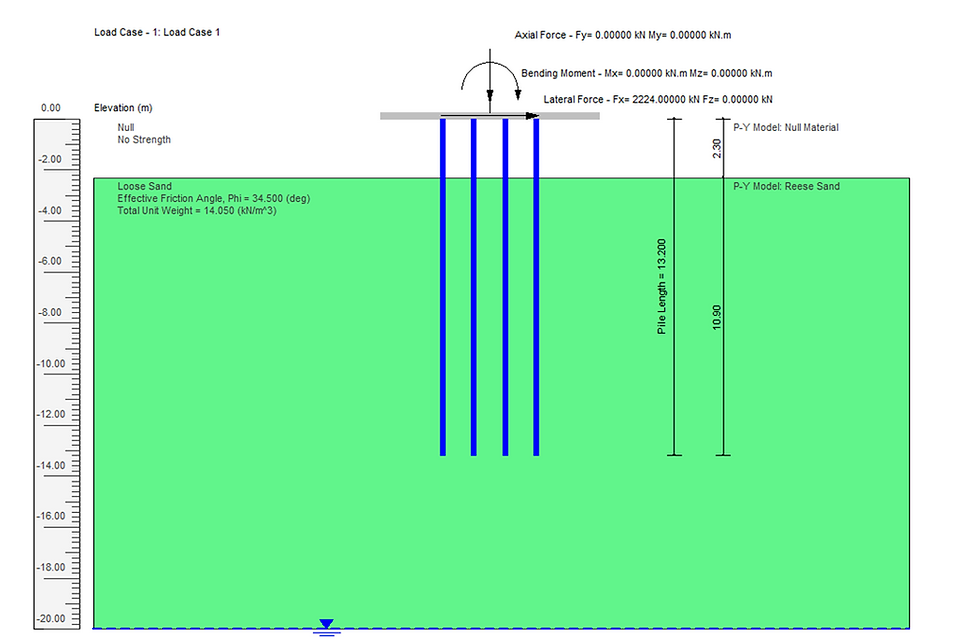
The figure below shows the soil layer information, pile group and pile cap loads defined in the program. It shows the thickness values for all the layers and the pile lengths.
For this example, the pile group effect option “User-specified p-multipliers for pile group effect” was adopted. According to Zhang et al. (1999), the p-multipliers were 0.8 for the leading row, 0.4 for the second row, 0.3 for the third and fourth rows. The adopted p-multipliers for all piles within the group are illustrated in Figure 7-4.

Figure 7-5 presents a comparison of the deflection profile of the front pile for the 3 × 4 pile group under lateral loading. The results obtained from the analysis using the PileGroup program are shown together with the measured field data and the predictions reported by Zhang et al. (1999) using FLPIER program. The numerical predictions from PileGroup show good agreement with both the experimental measurements and FLPIER predictions along the pile.
Figures 7-6 to 7-8 present comparisons of bending-moment profiles along the pile length with corresponding PileGroup predictions for the front, 2nd and 3rd rows under the applied load of 2224 kN, showing very close agreement with the measured test data and with FLPIER results reported by Zhang et al. (1999).


References:
1. Zhang, L., McVay, M. C., and Lai, P. (1999). Numerical analysis of laterally loaded pile groups. Journal of Geotechnical and Geoenvironmental Engineering, ASCE, 125(11), 936–946.


Comments