Validating PileLAT with a Full-Scale Single Pile Lateral Load Test (Christensen, 2006, BYU)
- Sep 28, 2025
- 2 min read
To demonstrate the reliability of our PileLAT program, we modelled the full-scale single pile lateral load test documented by Christensen (2006) at Brigham Young University. This benchmark case provided an excellent opportunity to validate the program against high-quality field data, with results that closely matched the measured responses.
In this study, a steel test pile was subjected to incremental lateral loads in interbedded sand and clay layers. The load–deflection response and bending moment distribution along the pile were carefully measured and published, providing an excellent reference for numerical modelling.
Using PileLAT, we modelled the soil–pile interaction with appropriate nonlinear p–y curve formulations. The computed lateral deflections and bending moments compared well with the field test results, demonstrating both the reliability and efficiency of the software in capturing soil–structure response under lateral loading.
The length of the pile from the load point to the toe is 16.6 m. The horizontal load is applied at a height of 0.48 m above the ground surface. The cross section of the pile is a circular pipe with a thickness of 0.0095 m and an outer diameter of 0.324 m. The total moment of inertia (I) for the pile is 1.43 x 10^8 mm^4 based on Christensen (2006) with considering two angle irons attached to the north and south sides of the piles. The elastic modulus is assumed to be 200 GPa.
The table below is extracted from Christensen (2006) for the soil layers and soil properties used in the PileLAT program.

The detailed ground profile and pile length modelled in the PileLAT program is shown in the figure below.

The inputs of the soil layers and p-y curve model parameters are defined with the dialog below in the PileLAT program:

The calculated load–deflection curve from PileLAT is presented in the figure below, together with the measured field test results and the LPILE analysis results reported by Christensen (2006). The close agreement between the PileLAT and LPILE curves indicates that PileLAT is able to closely reproduce the observed behavior, with results consistent with those obtained from established analysis methods.

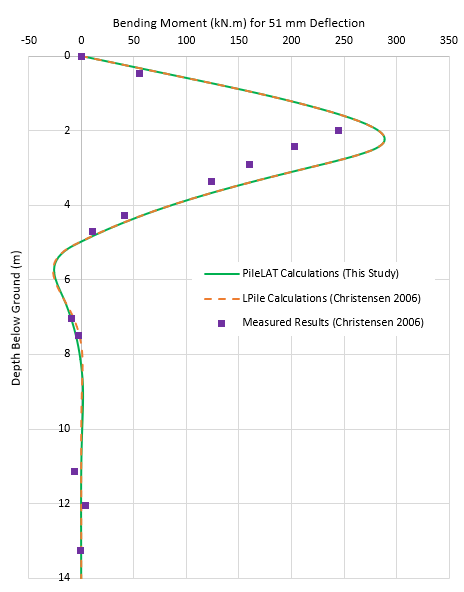
The following figures present the distribution of bending moment along the pile depth for three analysis cases corresponding to pile head deflections of 19 mm, 25 mm, and 51 mm. The results indicate that the bending moment profiles computed using PileLAT are in close agreement with the reference calculations and testing results reported by Christensen (2006).


This case study demonstrates that our PileLAT program is suitable not only for practical geotechnical design applications but also as a reliable tool for academic benchmarking against high-quality field test data. The results reinforce the program’s versatility and value for both practicing engineers and researchers involved in the analysis of laterally loaded piles.
Reference:
Christensen, D. (2006), “Full Scale Static Lateral Load Test of a 9 Pile Group in Sand.” BYU Scholars Archive


Comments